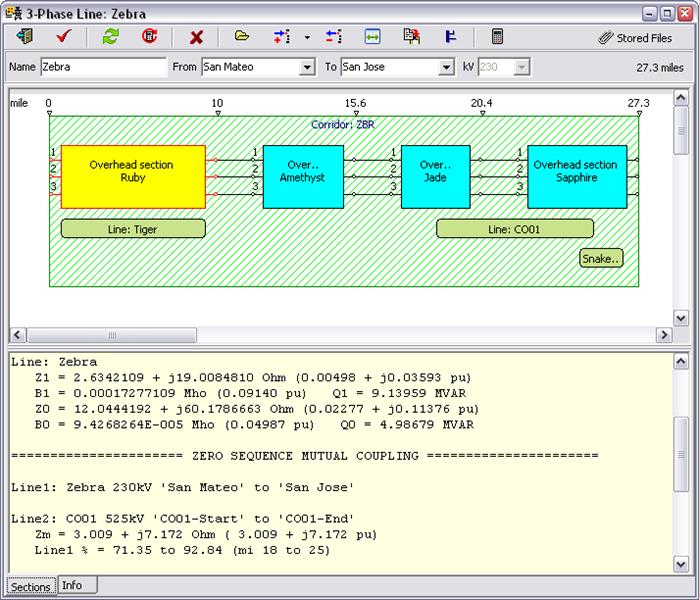
The Section tab displays the line-sections diagram and the line-constants report panel.
The line-section diagram shows all the sections that make up the line. The line sections are shown on the diagram as rectangles inside one or more corridors (which are shown as big shaded rectangles). In the picture above, the line Zebra has Sections Z1, Z2 and Z3 in corridor ZBR, and section Z4 in corridor TIG2.
Markers on top of the corridor frame indicate the end point of each section. Connection between sections is displayed for each phase conductor. If there are other lines that run parallel to this one, they are displayed in the line section diagram as well. In the diagram above, Tiger and CO0 are names of adjacent lines in corridor ZBR.
Double click on an object in the line section diagram will open the corresponding data form.
LINE CONSTANTS PANEL
The line constants panel displays
impedance and admittance of the currently selected section and of the entire
line. (Press the  button if this panel
is not visible.)
button if this panel
is not visible.)
The total line impedance is not shown if not all line sections are connected. The parameters are shown both in physical unit and in per-unit based on the line’s nominal kV and system base MVA. When the line shares the corridor with other lines, the zero sequence mutual coupling impedance and start/end position of all parallel pairs are also displayed.
Z1, Z0 - Positive- and zero-sequence self impedance in Ohms and in per-unit.
B1, B0 - Positive- and zero-sequence susceptance in Mhos and in per-unit.
Q1, Q0 - Positive and zero sequence line charging in MVAR.
Zm - Zero-sequence mutual impedance in Ohms and in per-unit.
Line1, Line2 % Start and end of mutual coupling section on line 1 and line 2. The distance is measured in percent of entire line impedance and also in mile/km from beginning of each line.